WIP: Scala JS Client
Even though the normal use case for ZMX is to use one of supported metric back ends, the ZMX team has decided to provide a simplified client using ScalaJS, so users can explore metrics capturing and visual presentation without having to install the pre-requisites for one of the back ends.
The ScalaJS client is not designed as a replacement for one of the dashboard implementations offering a much larger feature set. It is designed to quickly visualize ZMX metrics.
ZMX client technology stack
Server side
On the server side we use a MetricListener implementation that is registered within the ZMX instrumented application. This listener is defined in MetricsProtocol and uses a ZHub under the covers to create a
stream of MetricMessages.
The MetricsServer uses that stream to create a websocket stream of binary encoded MetricMessage once it receives
a Subscribemessage from a ScalaJS client.
Client side
The ScalaJS client creates a websocket connection to the instrumented server and starts processing the inbound
stream of MetricMessage.
The client is built on top of Laminar, so the stream of inbound messages is turned into a airstream, which is tightly integrated into Laminar.
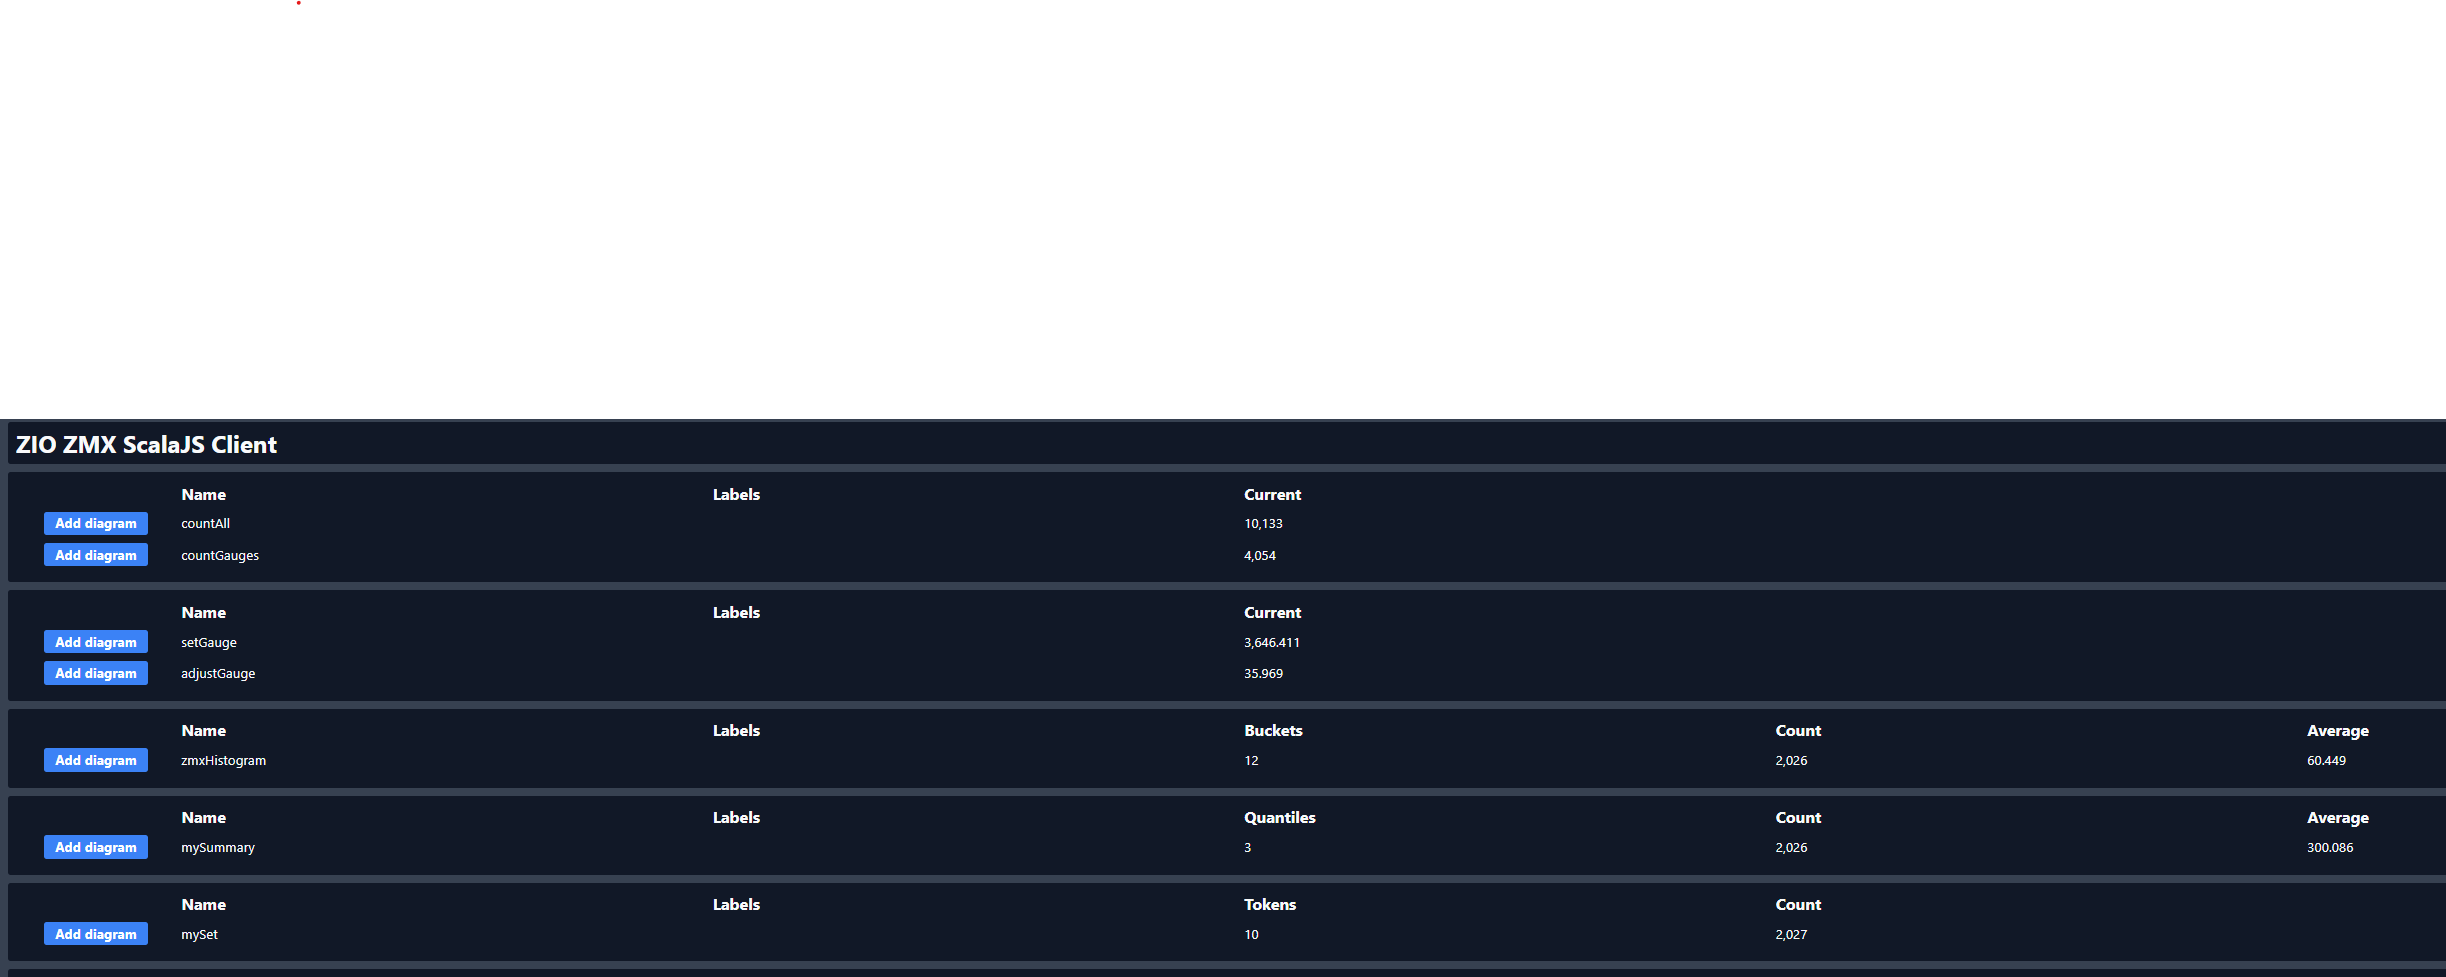
The incoming messages are summarized into tables, one table per metric type. Within each table, all of the distinct metrics encountered so far are displayed in a single line per metric. All lines display the metric name and the labels defined for the metric. Also, each line is amended with some summary information depending on the metric type.

On the left of each metric line a button Add diagram is located. A click on that button will create a diagram for
this particular metric to the Diagramssection of the page.
At the moment all diagrams are line diagrams with a time scaled horizontal axis. A diagram will display the line(s) for a single metric, so in the case there will be one line only. For histogram there will be a line per bucket and also for the average. For summaries there will be a line per quantile and also for the average. For sets there will be a line for each distinct value of the set.
Each diagram will update automatically according to the inbound stream of data. To make the update smoother, a diagram will sample the inbound data stream every 5 seconds and perform the refresh. Also, each diagram will capture at most 100 time slots - forgetting the oldest entry once the buffer is filled up.


Working on the ZMX client
To work on the client, besides sbt node has to be installed on the development machine. The directory client/js
is the base directory for all Node JS related tasks.
Prepare the environment
- At first, run
yarn installwithinclient/js. - Build the tailwind based CSS with
npx tailwind -i src/main/index.css -o ./target/rollup/main.css
Build and run the instrumented server / client
Start the instrumented Server with with web socket server from the ZMX checkout directory with
sbt clientJVM/runIn another shell start a continuous compile of the Scala JS client code by starting a sbt shell and execute
~clientJS/fastOptJS. This will recompile the Scala JS code upon each save of a related source file.In yet another shell, from within
client/jsstartnpx vite build -m development --watch. This will repackage the web application upon on each change.In yet another shell, from within
client/jsstartnpx vite. This will start a local HTTP server on port 3000 picking up the currently packaged application.http://localhost:3000will now display the client.In case you want to use a browser on a different machine than the machine where you have started the vite server, you have to start the vite server with
npx vite --host 0.0.0.0, so that the vite server starts to listen on all network interfaces.
Ideas for further development (non-exhaustive)
- We want to be able to edit the diagrams. At a minimum we want to set the refresh interval per diagram and also the buffer size that determines how many time slots are being kept for the diagram.
- Ideally we could change the color for each line displayed in a diagram.
- We want to have each diagram have an editable title.
- In each diagram, we want to have the option of adding more metrics to the same diagram.
- It might make sense to change the diagram type, for example a bar chart or pie chart might make sense for sets.
- Ideally, the configuration for each diagram could be captured in a JSON serializable case class, so that we could store the state of all diagrams currently displayed within the web page to JSON. We could have a dialog where we could simply display the current JSON to copy it into a file and another dialog to paste a JSON config for setting the diagram state. Potentially we could use local browser storage for storing and retrieving JSON.
